React hooks - useDebugValue

Web Development fanatic, excited about learning anything related to the same, from the basics to the advanced. I am a final year undergraduate at the International Institute of Information Technology, Bhubaneswar. I like to solve problems and learn about complex algorithms, and new technologies, and I aspire to create an impact in the world of Computer Science someday ❤️. Apart from Web Development, I am currently exploring and learning about iOS App development.
Introduction
While generally, developers know about the commonly used react hooks like useEffect, useState, etc. useDebugValue is something that is not known to most developers but it proves to be a very useful hook when it comes to debugging errors. Let us learn about it.
The useDebugValue hook
Debugging React applications can be a time-consuming process. Normally debugging information is only limited to displaying information about in-built hooks and this information is difficult to read as there are no labels, so a developer usually has to track down the data stored by the hooks in the console which is time-consuming.
The useDebugValue hook simplifies this process by adding a label to the debugging information in the React DevTools making it easier and faster for the developers to locate the source of the debugging information and debug an error if it ever occurs, or it can be used to provide the necessary information if the developer has created a library for public use. This debugging information is shown in the React DevTools which is an extension that can be downloaded on any major browser out there.
But there's a catch.
The useDebugValue hook can only be used with custom hooks.
It doesn't return anything and it accepts two parameters. The first is a value, and the second is a function whose usage is something that I will talk about a little bit later.
A custom hook can contain multiple useDebugValue hooks. In that case, the debugging information is shown in an array under a label.
Let us look at an example to understand it in depth.
import useFill from "./hooks/useFill";

export default function App() {
    const performOperation = true;
    const [ fillData ] = useFill(performOperation);

    return (
        <>
            <div>
                {
                    fillData.map((item, index) => {
                        return (
                            <div>
                                { item }
                            </div>
                        )
                    })
                }
            </div>
        </>
    );
}
import { useDebugValue, useEffect, useState } from "react";

export default function useFill(performOperation) {
    const [ data, setData ] = useState([]);
    const smiley = '😁'
    let list = [];

    useDebugValue(`smiley: ${smiley}`);
    useDebugValue(data);

    useEffect(() => {
        if(performOperation) {
            for(let i = 0; i < 10; i++) {
                list.push(i);
            }

            setData(list);
            list = [];
        }
    }, [performOperation]);


    return [ data ];
}
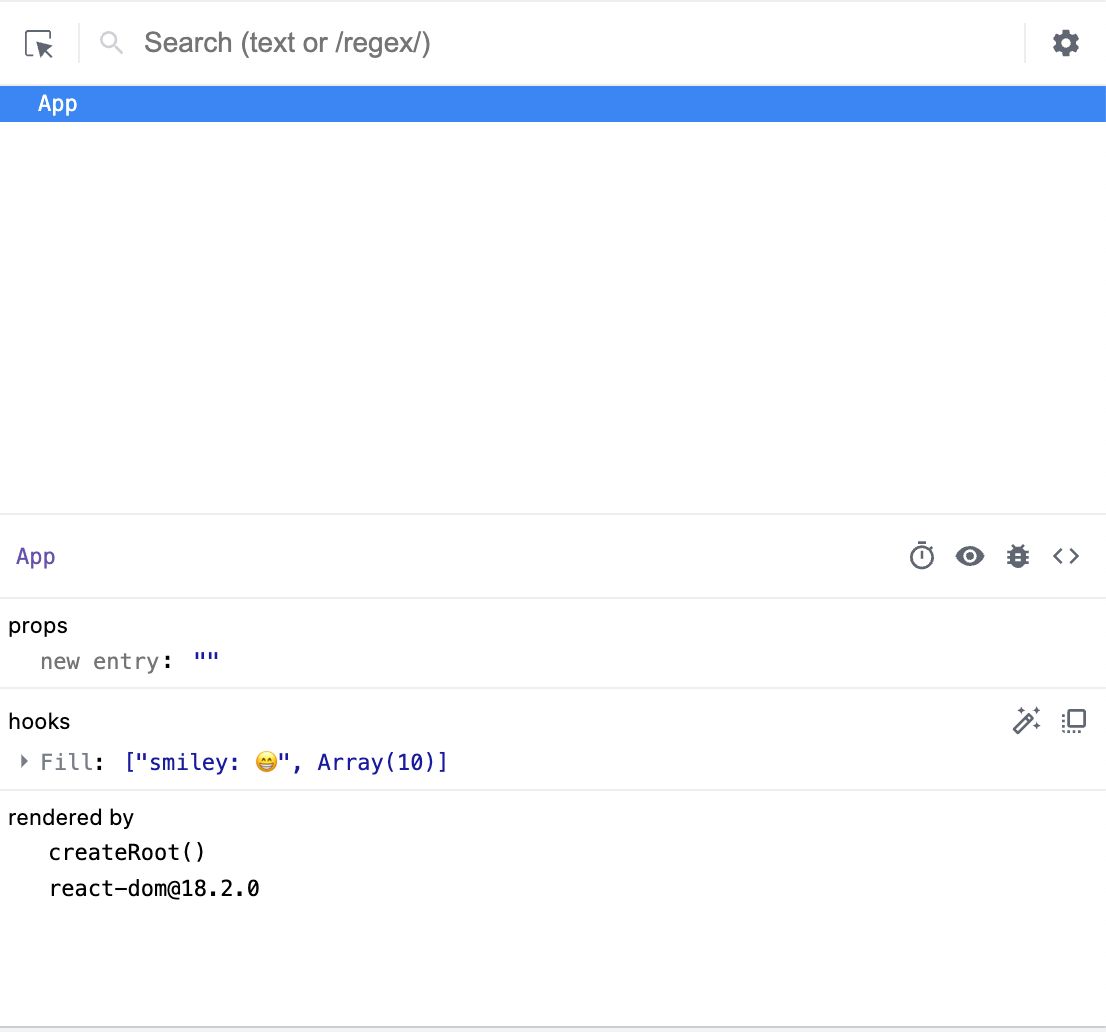
As you can see in the image above, the debugging information comes with the label "Fill" under the hooks section. Expand it and you can see detailed information.

But this is simply an example to help you understand how to use useDebugValue. Imagine a scenario where you are trying to fetch some data using an API, and the operation fails. You could identify easily and quickly where that error could be occurring in your code by identifying the source of the debugging information if you were using useDebugValue in your custom hook for fetching data from an API.
Performance Issues
Usually, when you include debug code, it could impact the performance of an application. So to tackle the issue, the useDebugValue takes in a second parameter which is a function which only runs the debug code when you click on the component that utilises the custom-created hook in the React DevTools.
Let us look at an example.
import { useDebugValue, useEffect, useState } from "react";

export default function useFill(performOperation) {
    const [ data, setData ] = useState([]);
    const smiley = '😁'
    let list = [];

    useDebugValue(`smiley: ${smiley}`);
    useDebugValue(data);

    useEffect(() => {
        if(performOperation) {
            for(let i = 0; i < 10; i++) {
                list.push(i);
            }

            setData(list);
            list = [];
        }
    }, [performOperation]);


    return [ data ];
}

function fillData(d) {
    for(let i = 0; i < 300000000; i++) {}
    return d;
}
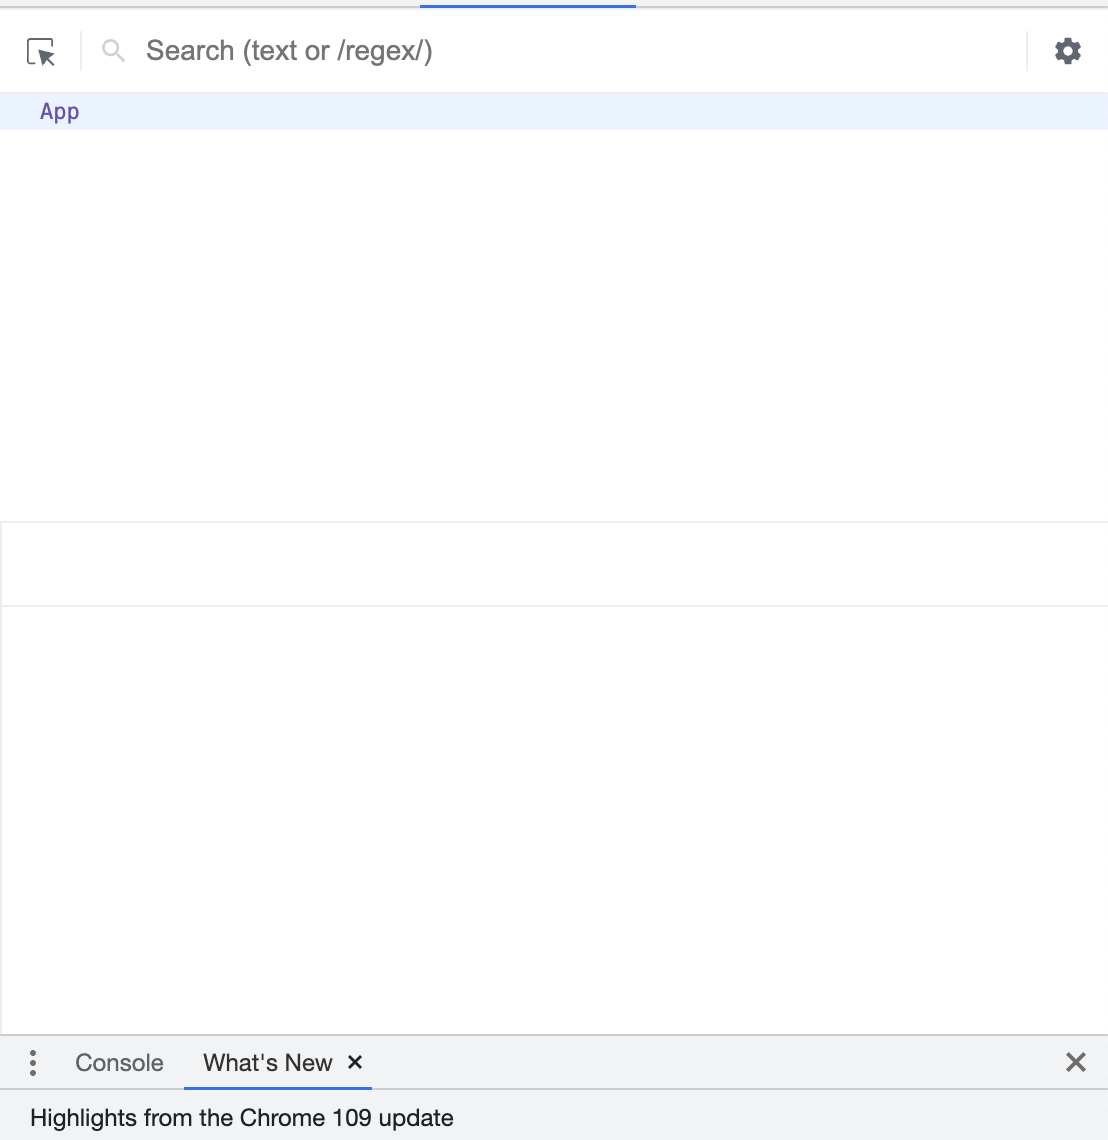
( Only after clicking the "App" component, it calculates the label and shows the debugging information. )

The above example is the same as the one provided at the beginning of the blog. The difference is the function "fillData". As you can see the function is a slow function and if every time it runs then it can degrade the performance of an application. Do understand that the example is simply a simulation of a real issue, but it does explain an issue that developers could face during the development of an application. To avoid such issues, we provide the function as a second parameter which only calculates the label when you click on the component that utilises the custom hook in the React DevTools.
Final Thoughts
The useDebugValue hook is great for debugging issues when used wisely. Hope you learned something new today. I will meet you in my next blog, till then buh-bye. Stay safe, happy, and code furiously!!
You can follow me on Github, LinkedIn.
Thank you for reading.


